quantem.widget#
Interactive, GPU-aware Python widgets for electron microscopy. Use them in Jupyter notebooks, as local HTML files, or from the command line.
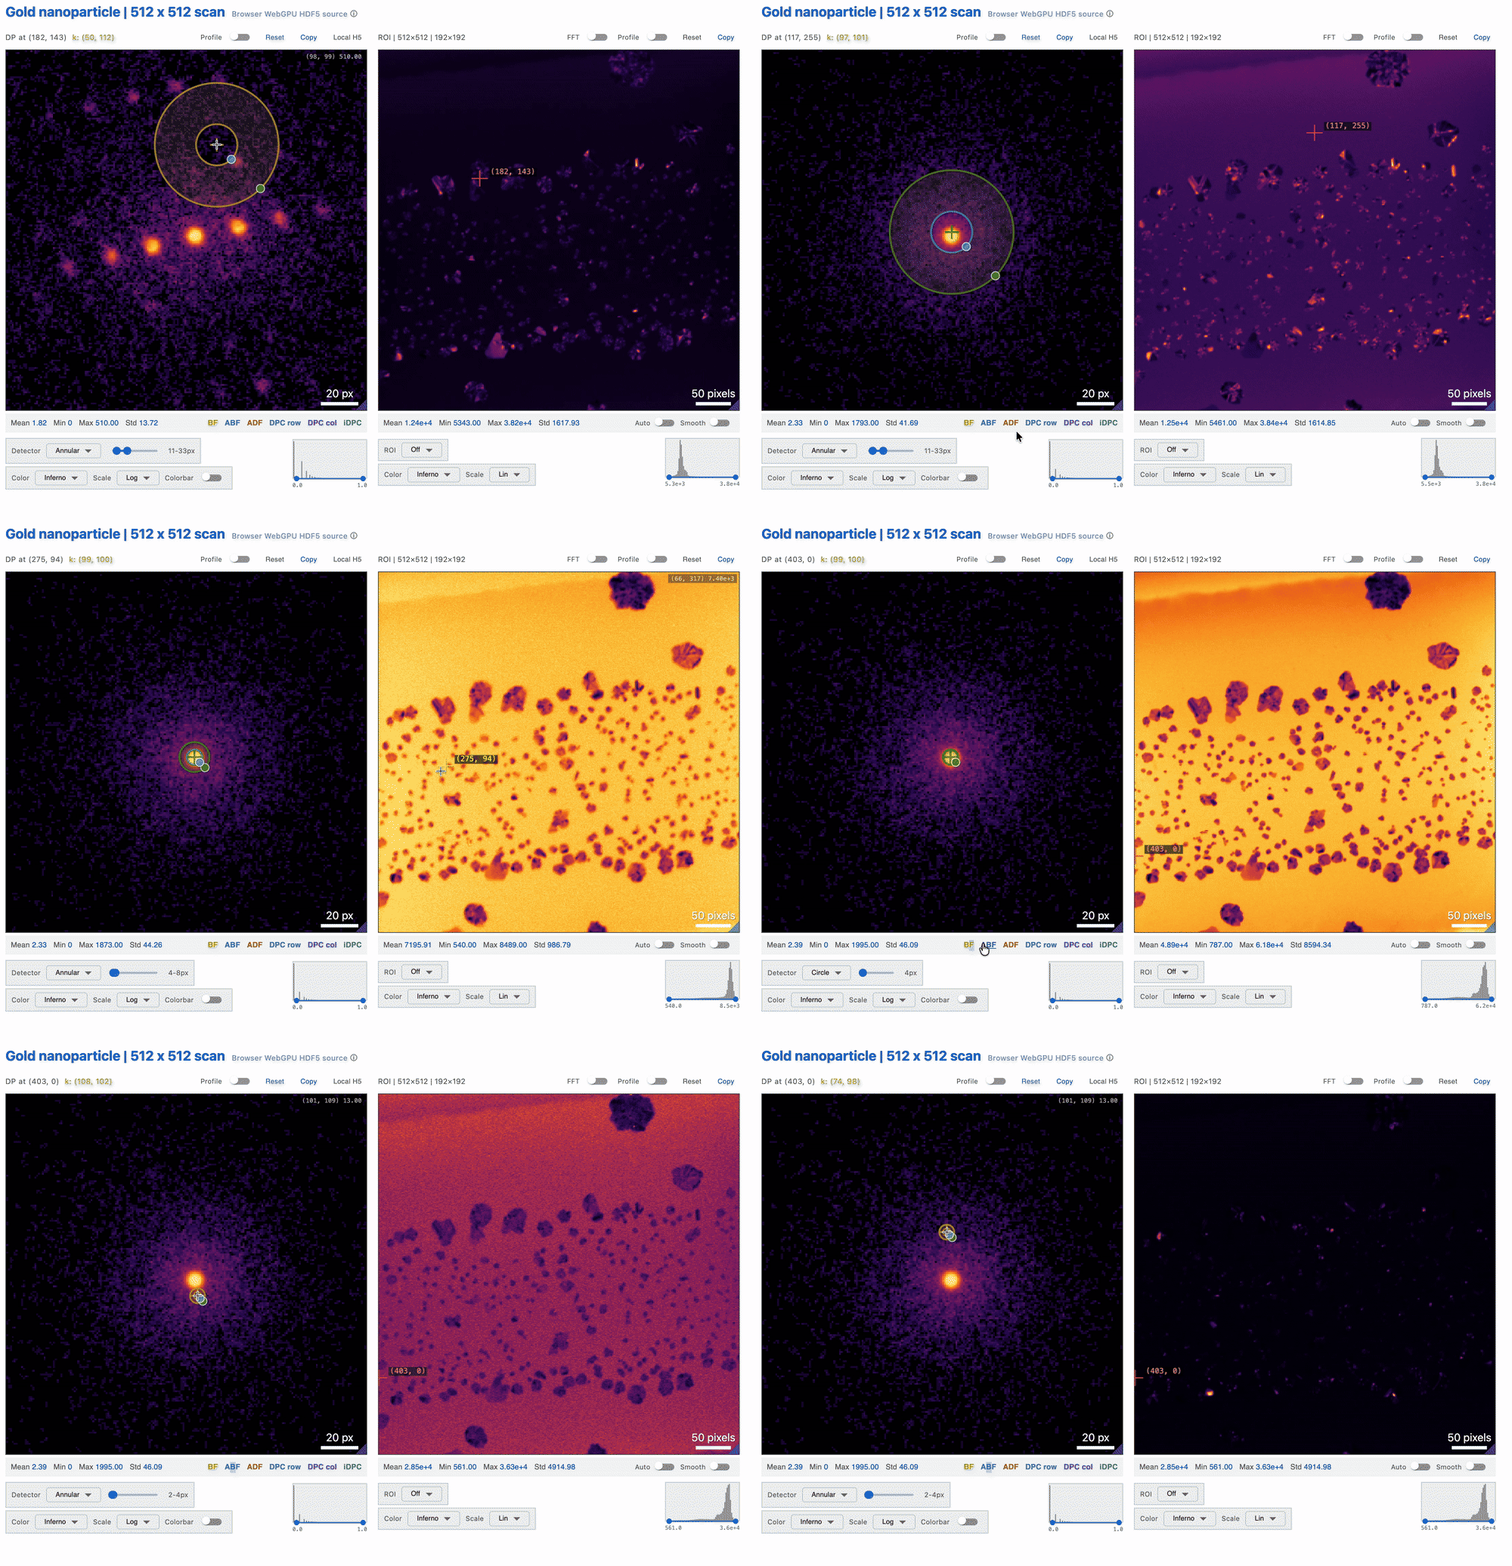
Demo: Show4DSTEM HTML with WebGPU. Explore live diffraction-pattern and virtual-detector views locally in a browser on a personal laptop or supported phone, without a Python kernel or remote compute server. Thanks to Serin Lee for sharing this liquid-cell Au nanoparticle 4D-STEM dataset. Check Serin’s 4D-STEM and 5D-STEM segmentation and clustering work (paper) and the source data (Zenodo).
Start with ARINA 4D-STEM in Jupyter#
The demo above is the same Show4DSTEM workflow you can use at the microscope.
After installing, open a Jupyter notebook, load a completed ARINA
*_master.h5 file, and pass the result directly to the widget:
from quantem.gpu.io import load
from quantem.widget import Show4DSTEM

data = load("/data/session/scan_000_master.h5")
viewer = Show4DSTEM(data)
viewer
load(...) selects CUDA or Apple Metal automatically. Leave viewer as the
final line, then move through scan positions or drag the detector to update the
virtual image. Continue with the Show4DSTEM tutorial or
Load and I/O.
Prefer the command line?#
Point the quantem command at a file or folder when you want the same viewers
without writing a notebook:
quantem show2d image.tif         # an image            -> Show2D
quantem show3d ./frames/         # a folder of frames  -> Show3D scrub
quantem show4dstem ./masters/    # 4D-STEM master(s)   -> live viewer (or --html)
It saves to ~/Downloads, opens automatically, and picks the GPU for you. Full
details are on the command line page.
Built for two platforms#
We serve two audiences first:
macOS on Apple M-chips - the Metal (MPS) GPU.
Linux with NVIDIA CUDA - workstations and HPC.
CUDA and MPS are the primary backends. Work stays on the GPU as PyTorch
tensors; we avoid NumPy on the hot path. Automatic scientific loading and
compute never silently fall back to CPU: an unsupported machine fails with a
corrective error. The explicit CPU reference exists for parity tests, while the
viewers can still display ordinary NumPy arrays supplied by a user. For large
datasets, bin the detector at load (det_bin) to cut memory and speed first
paint - see Load and I/O.
Widgets#
Widget |
Use it for |
Tutorial · API |
|---|---|---|
|
Interactive traces, live reconstruction metrics, line profiles, and linked image snapshots |
|
|
One or many 2D images: contrast, FFT, ROIs, line profiles, scale bars |
|
|
A 3D volume scrubbed slice-by-slice (e.g. a ptychographic object) |
|
|
Side-by-side slices of a 3D volume across an axis |
|
|
4D-STEM: live virtual detectors, multi-master review, and WebGPU HTML export |
|
|
Ptychography aberration review: phase, FFT, BF-count tradeoffs, and WebGPU folder export |
|
|
2D/3D diffraction d-spacing: Bragg spots, rings, center finding, k calibration |
|
|
Pick an origin and two lattice vectors on a 2D image |
|
|
Folder-level microscopy browser: navigate a session, review thumbnails, select files/folders, and save curation state |
The Tutorials walk through each widget on real public data where practical, with compact synthetic data only where it keeps an example portable. Real tutorial datasets are downloaded from public data hosting such as Hugging Face and cached locally; they are not committed to this repository or bundled into the Python wheel. That keeps clone size and microscope-PC installs small while still letting the rendered docs use realistic microscopy examples. The Show4DSTEM export recipes show how to choose between compact report HTML, interactive raw-4D WebGPU HTML, and terminal exports. The ShowFolder tutorial covers folder browsing workflows and how to save and share widget exports. The API reference documents every parameter, method, and interactive control (and doubles as a UI-test spec for automated agents). All example data here is synthetic or pulled from a public Hugging Face dataset - no private data ships in the docs.
Every widget accepts a NumPy array, a PyTorch tensor (CPU or GPU), or a quantem
Dataset (Dataset2d / Dataset3d / Dataset4dstem), pulling calibration and
units automatically from the dataset when present.
Offline by default in these docs#
The Show2D, Show3D, and Show3DSlices examples on this site were exported with
encoding="uint8", which bakes the display data into the widget as a uint8
stack (4x smaller than float32, and the colormap clamps to 256 levels anyway so
it looks identical). The canvas below each example stays fully
interactive in this static page with no running kernel: scrub, zoom, change
contrast, toggle the FFT - all in the browser. Show4DSTEM goes further: for a
small dataset its virtual-detector math runs in WebGPU, so dragging the
aperture recomputes the virtual image in the browser. Show4DSTEM exports make
the dtype explicit: uint8 is a compact browse payload, while uint16 keeps the
wider detector-count range at a larger size. See
Show4DSTEM export recipes for when to choose each.
ShowEDS uses the same saved-widget model for synthetic and small cubes in single mode with exact data. For large native EDS/EELS files, the notebook keeps the interactive state while the exact count data stays in a data folder. Portable HTML demos can be exported with count-preserving sum downsampling when full-resolution data would be too large for public sharing.
See Installation to get started.
Citing quantem.widget#
If the quantEM interactive framework—including quantem.widget, GPU-accelerated
I/O, analysis, or reconstruction workflows on MPS or CUDA—contributed to your
research, please consider citing Lee et al., Interactive Framework for
Real-Time 4DSTEM Analysis and Reconstruction, Microscopy and Microanalysis
32 (Supplement 1), ozag053.941 (2026),
https://doi.org/10.1093/mam/ozag053.941.
Getting help#
Questions or bugs: open an issue at github.com/electronmicroscopy/quantem.widget/issues.
New widgets and cross-widget refactors: discuss first (issue or maintainer). In-widget bug fixes can open a pull request directly. See Pull requests and CONTRIBUTING.md.
Tutorial data: public bobleesj/quantem-data. Upload and download commands are on that dataset card. The GitHub loader pull request is in Contribute tutorial data.
Maintained by the Ophus group.