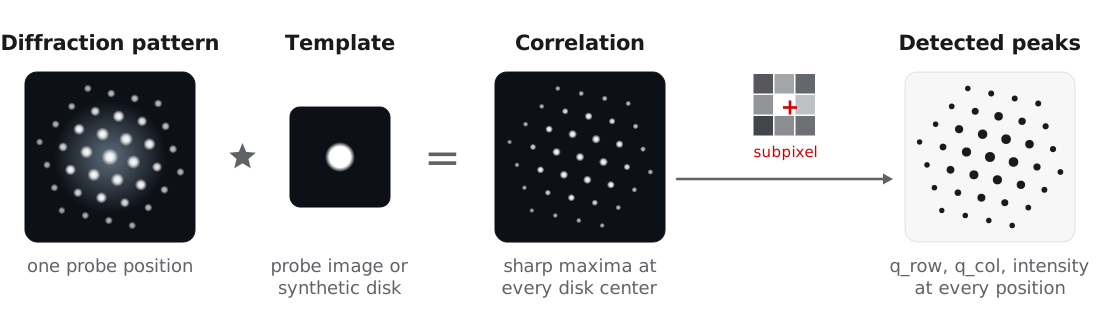
In nanobeam and 4D-STEM experiments, each Bragg reflection appears as a disk on the detector, and the disk centers give the projected reciprocal lattice at each probe position. BraggVectors finds these disks by template matching: each pattern is cross-correlated with an image of one disk, and the maxima of the correlation are refined to subpixel positions. The detected peaks are the input to calibration, orientation and phase mapping, and strain mapping.
This approach follows the template matching in py4DSTEM (Savitzky et al., 2021). Pekin et al. (2017) compared cross, phase, and hybrid correlation for disk registration, and all three are available through the corr_power parameter. The examples use the titanium dataset of MacLaren et al. (2024), described in orientation and phase mapping.
Building a template
| Method | Template | Use for |
|---|---|---|
make_template_from_probe | Probe image recorded over vacuum | Most accurate, when available |
make_template_from_data | Data averaged over a region | Scans that include vacuum or thin amorphous regions |
make_template_synthetic | Disk with a soft edge | Data without a probe measurement |
No vacuum probe was recorded for the titanium dataset, so we use a synthetic disk matched to the direct beam:
from quantem.core.io.file_readers import read_emdfile_to_4dstem
from quantem.diffraction import BraggVectors

dataset = read_emdfile_to_4dstem("Ti550_005_downsampled.h5")
dataset.sampling = [30.0, 30.0, 1.0, 1.0]       # 30 Angstrom scan step
dataset.units = ["A", "A", "pixels", "pixels"]

bv = BraggVectors.from_dataset(dataset)
bv.make_template_synthetic(radius=0.75, edge=1.0)
Detection parameters
| Parameter | Titanium value | Effect |
|---|---|---|
min_abs_intensity | 40.0 | Minimum correlation peak intensity. It scales with the template size, so retune it after changing the template. |
min_spacing | 4.0 | Minimum distance between peaks, in pixels. |
edge_boundary | 2.0 | Ignores peaks within this many pixels of the detector edge. |
background_sigma | 1.0 | Width of a high-pass filter on the correlation, which removes slowly varying background around the direct beam. Set it slightly wider than a disk. |
subpixel | "upsample" | Subpixel refinement: "none", "parabolic", or DFT upsampling (Guizar-Sicairos et al., 2008). |
corr_power | 1.0 | 1 for cross-correlation, 0 for phase correlation, hybrid in between. Lower values find more weak disks but compress the measured intensities. |
detect_params = dict(
    min_abs_intensity=40.0,
    min_spacing=4.0,
    edge_boundary=2.0,
    background_sigma=1.0,
    subpixel="upsample",
    upsample_factor=16,
    max_num_peaks=500,
)
Testing on a few positions
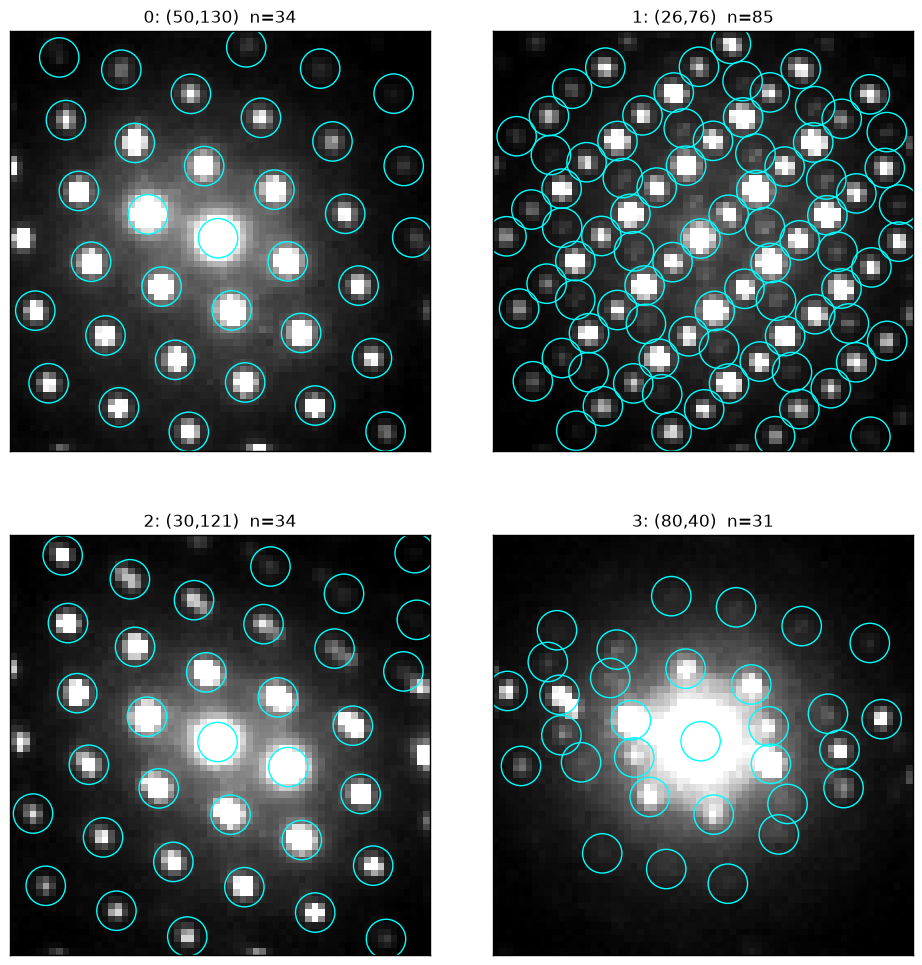
We recommend tuning these parameters on a few probe positions before running the full scan. show_detection draws the detected peaks without changing the workflow state:
test_positions = [(50, 130), (26, 76), (30, 121), (80, 40)]

bv.show_detection(
    positions=test_positions,
    **detect_params,
    peak_radius=3,
    ncols=2,
    norm={"power": 1.0, "upper_quantile": 0.95},
)
Detecting the full scan
peaks_px = bv.detect_disks(**detect_params)The 19,100 patterns of the titanium scan take about 10 s on a laptop CPU, and batching makes detection faster still on a GPU (BraggVectors.from_dataset(dataset, device="cuda")). The peaks are stored in bv.peaks as a Vector of [q_row, q_col, intensity] in detector pixels. They still include the descan and have no reciprocal space calibration, which the next step, calibration, corrects.
- Savitzky, B. H., Zeltmann, S. E., Hughes, L. A., Brown, H. G., Zhao, S., Pelz, P. M., Pekin, T. C., Barnard, E. S., Donohue, J., Rangel DaCosta, L., Kennedy, E., Xie, Y., Janish, M. T., Schneider, M. M., Herring, P., Gopal, C., Anapolsky, A., Dhall, R., Bustillo, K. C., … Ophus, C. (2021). py4DSTEM: A Software Package for Four-Dimensional Scanning Transmission Electron Microscopy Data Analysis. Microscopy and Microanalysis, 27(4), 712–743. 10.1017/s1431927621000477
- Pekin, T. C., Gammer, C., Ciston, J., Minor, A. M., & Ophus, C. (2017). Optimizing disk registration algorithms for nanobeam electron diffraction strain mapping. Ultramicroscopy, 176, 170–176. 10.1016/j.ultramic.2016.12.021
- MacLaren, I., Frutos‐Myro, E., Zeltmann, S., & Ophus, C. (2024). A method for crystallographic mapping of an alpha‐beta titanium alloy with nanometre resolution using scanning precession electron diffraction and open‐source software libraries. Journal of Microscopy, 295(2), 131–139. 10.1111/jmi.13275
- Guizar-Sicairos, M., Thurman, S. T., & Fienup, J. R. (2008). Efficient subpixel image registration algorithms. Optics Letters, 33(2), 156. 10.1364/ol.33.000156